Your application is deployed. Your GKE cluster is humming, your databases are ready, and your functions are awaiting triggers. You’ve built the ship. But now you have to sail it, and sailing in the cloud can feel like navigating through a thick fog.
Is the application healthy? Are users getting errors? Why did that request take five seconds? Without the right tools, your sophisticated system is a complete black box. This is the problem of observability, and it’s the art of understanding the internal state of your system by observing its external outputs.
In Google Cloud, observability is handled by the Cloud Operations suite (formerly Stackdriver). It’s not one tool, but a set of five powerful, interconnected services that act as the eyes, ears, and diagnostic scanners for your entire cloud environment.
Let’s step onto the bridge and learn how to investigate an issue from the first alert to the exact line of code.
The Red Alert: Cloud Monitoring
It’s 3 AM. You’re woken up by a notification on your phone. This is the start of our investigation, and it begins with Cloud Monitoring.
Cloud Monitoring is your ship’s bridge. Its job is to watch your system’s performance metrics and tell you when something is wrong.
- Metrics: Monitoring is built on metrics—time-series measurements of anything from VM CPU utilization to load balancer latency or the number of messages in a Pub/Sub topic.
- Dashboards: This is your main viewscreen, where you build custom charts and graphs to get an at-a-glance view of your application’s health.
- Uptime Checks: These are sentinels that constantly check your public endpoints from around the world to ensure your application is reachable.
- Alerting Policies: This is the red alert system. An alerting policy watches a metric and, when a condition is met (e.g., “5xx error rate > 5% for 5 minutes”), it sends a message via a notification channel (like PagerDuty, Slack, or email). A great alert also includes documentation—a link to a runbook telling the on-call engineer what to do.
Our alert says the 5xx error rate is high. We know what is wrong, but we don’t know why. Our first step is to check the ship’s logbook.
The Investigation Begins: Cloud Logging
Cloud Logging is the centralized, searchable library for every log from every service in your project. Logs from most GCP services stream here automatically. For your VMs, you install the Ops Agent to collect logs, metrics, and traces.
Using the Log Explorer, you quickly filter for logs with severity=ERROR from the last 15 minutes. You find hundreds of entries with the message: "Error: Request to payment-service timed out after 3000ms".
Now we have a clue! It’s not our main application that’s failing; it’s failing because its downstream call to the payment-service is timing out. But the payment-service itself is a complex beast that calls three other microservices. Where is the actual delay?
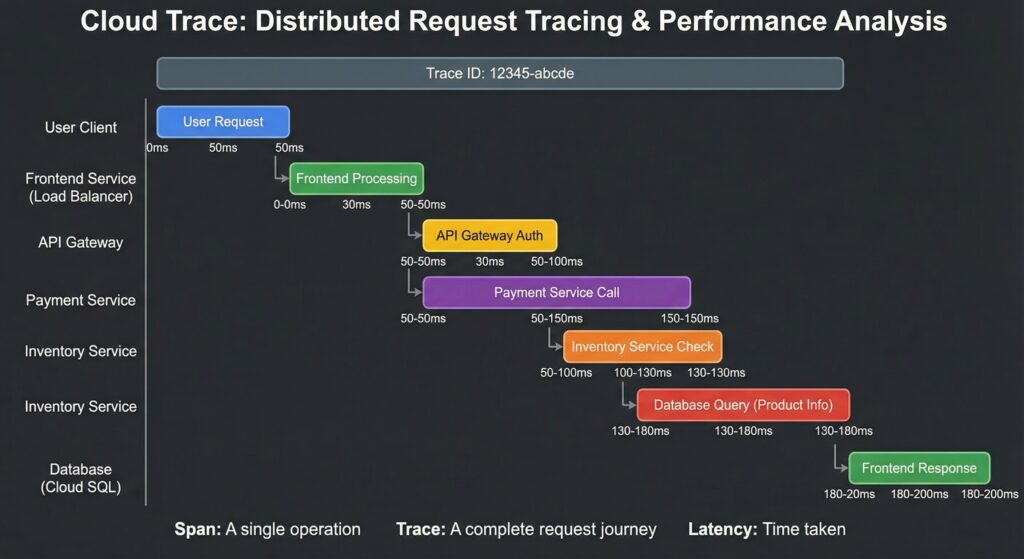
Following the Trail: Cloud Trace
This is the perfect job for Cloud Trace, a distributed tracing system that acts like a GPS tracker for your requests.
Trace allows you to follow a single request as it travels through all the different services in your application. By instrumenting your code with a client library, Trace assigns a unique ID to each request and visualizes how much time was spent in each service call (each “span”).
You find a trace for a failed request and see a waterfall graph. It clearly shows the request spent 2,950ms of its 3,000ms timeout waiting for a response from the fraud-detection-service. We’ve found the slow service!
Zooming In on the Culprit: Cloud Profiler
We know the fraud-detection-service is the bottleneck, but why? Is it stuck in an inefficient loop? Is it struggling with memory allocation?
Cloud Profiler is the magnifying glass for your code’s performance. It continuously analyzes the CPU and memory usage of your applications in production with very low overhead. It helps you identify which specific functions or lines of code are the most resource-intensive.
You pull up the CPU profile for the fraud-detection-service from the last hour. The flame graph is a dead giveaway: a function called calculateRiskScoreV2 is consuming 95% of the CPU time. You’ve narrowed the problem down from a high-level alert to a single, specific function.
The Live Inspection: Cloud Debugger
The calculateRiskScoreV2 function is complex, and the bug only seems to happen with a specific type of user data that you can’t easily reproduce in your test environment. You need to see what’s happening inside that function in production, but you can’t just halt the service.
Cloud Debugger is your production X-ray. It lets you inspect the state of a live, running application without stopping or slowing it down for other users.
You connect Debugger to your GKE service and set a snapshot on a key line inside the calculateRiskScoreV2 function. The next time a request executes that line, Debugger captures the full call stack and the values of all local variables at that exact moment.
The snapshot reveals the issue: a variable that should contain a user ID is occasionally null, causing the risk-scoring algorithm to enter a massive, inefficient recalculation loop. You’ve found the root cause.
The Complete Observability Workflow
This investigative story shows how the Cloud Operations tools work together. it is very important to know which tool does what
- Is something wrong?
- Cloud Monitoring gives you the high-level picture with Alerts and Dashboards.
- What is the specific error?
- Cloud Logging lets you dive into the details with the Log Explorer to find the exact error message and context.
- Where is the latency in my distributed system?
- Cloud Trace shows you the request’s journey across microservices to find the latency bottleneck.
- Which line of code is using the most CPU/memory?
- Cloud Profiler analyzes your code’s performance to find the inefficient functions.
- What is the live state of my code at this exact moment?
- Cloud Debugger lets you inspect variables and the call stack in production without halting the application.
Supporting Pillar: Archiving Logs with Sinks
While Cloud Logging is great for real-time analysis, storing all your logs there forever can be expensive. A Sink is an automated rule for exporting logs to other destinations for compliance or long-term storage:
- Cloud Storage: For cheap, long-term archival.
- BigQuery: For complex, SQL-based analysis.
- Pub/Sub: For streaming logs to other tools like Splunk.
Common Pitfalls & Best Practices
- Pitfall: Not installing the Ops Agent on GCE VMs. You’ll be blind to what’s happening inside your instances.
- Best Practice: Install the Ops Agent on all VMs as part of your standard build process.
- Pitfall: Creating “noisy” alerts in Monitoring that lead to alert fatigue.
- Best Practice: Tune your alert conditions carefully with appropriate durations. Always use the Documentation field to provide context and runbooks.
- Pitfall: Forgetting to instrument your code for Trace and Profiler.
- Best Practice: Add the necessary client libraries to your applications during development so that you have deep visibility when you need it most.
- Pitfall: Storing all logs in Cloud Logging indefinitely.
- Best Practice: Use Sinks to route logs to appropriate destinations. Keep logs in Cloud Logging for a short period (e.g., 30 days) and archive the rest to Cloud Storage.
Quick Reference Command Center
While much of the Cloud Operations suite is best used through the UI, here are some key commands.
| Service | Action | Command |
|---|---|---|
| Logging | Read Logs | gcloud logging read "[FILTER]" |
| Logging | Create a Sink to GCS | gcloud logging sinks create [SINK_NAME] storage.googleapis.com/my-bucket --log-filter="severity>=ERROR" |
| Monitoring | List Notification Channels | gcloud alpha monitoring channels list |
| Monitoring | Describe an Uptime Check | gcloud alpha monitoring uptime-checks describe [CHECK_NAME] |